Throw Darts to Estimate π
When you've got a hammer and that hammer is a year's worth of learning probability you sort of want to beat everything into submission with R. To keep with the spirit, let's use us some R and the Monte Carlo method to calculate PI by throwing darts at a dart board.
What is pi? I can't answer that. Here is what I can say; figuring out the area of a circle is tough but figuring out the area of a square is easy as pie. Just multiply one side by the other (A = S*S or A=S\^2) and you've got the area of a square. We'll start there. An easy way to measure a circle is center to the edge. That's the radius (R). If we multiply R * R to calculate the area of a circle, we'll wind up with not the area of the circle, but the area of a square that is 1/4 the size of the circle. Stay with me. Here is a picture:
Picture of 1/4 circle inside a square.
We're getting somewhere. Imagine we could somehow subtract the excess area (That shaded part.) Do that, multiply by 4 and you've got the area of a circle. Great! But, how can we possibly figure out how much to take away?
We need to find a number that is the proportion between the area of the square and the area of 1/4 a circle. Say we find that magic number. Then we just multiply the area of the square by that number, multiply by 4 and we're golden. Of course, the number is going to be less than 1 because the 1/4 circle fits inside the square.
Area of a Circle = 4 * magic number * R\^2
Guess what, 4 * magic number equals pi. You're almost there. The trouble is how do you figure out the magic number?
Remember when I said it was the proportion between the size of the square and the size of the 1/4 circle? How can we possibly figure out the proportion? What if we throw some darts at it? If we don't aim, every dart should hit a random place on the board. Some will wind up in the circle. Some will be outside. If we count the number that land inside and divide by the total number of throws, we've got some sort of a proportion. Could that possibly work?
Why not? In fact, let's throw a bunch of darts at it. Count the number of darts that land inside the circle and divide by the number of darts thrown. Doing that gives you the proportion:
Number of darts inside circle / total darts = area of a circle / area of the square
Take a second to realize the proportion is exactly the same if you're throwing darts at 1/4 of a circle enclosed in a square or a whole circle enclosed in a larger square. The circle in a square is completely symmetric. So, you'll get the same proportion if you figure it out once, or a dozen times (in this case, it is 4 times.) Make sense? Great!
Ok then, let's throw some darts at a board and start counting. If you think about it, the more darts you throw, the better your estimate should be. (we'll show that's true in a minute.) Go ahead and throw 1,000 darts and count them Wait, what? You're too busy for that? Ok, let's simulate it with a computer. Here is some R code that will do exactly that.
i=1
n<-10000
result = array( dim=c(3,n))

for (i in 1:n) {

  hits <- data.frame(x=runif(i,-1,1),y=runif(i,-1,1))
  hits$d<-sqrt(hits$x^2+hits$y^2)

  inside <-subset(hits, d<1)

  estpi<-4*nrow(inside)/i

  esterr<-pi - estpi

  result[1,i]<-i
  result[2,i]<-estpi
  result[3,i]<-esterr
}
# plot
hits$col<-ifelse(hits$d > 1, 1,2)
plot(hits$x,hits$y, col=c('red','blue')[hits$col],pch='.')
The code plots the points inside the circle in blue and those outside in red by calculating the point's distance from the origin. Here's the plot:
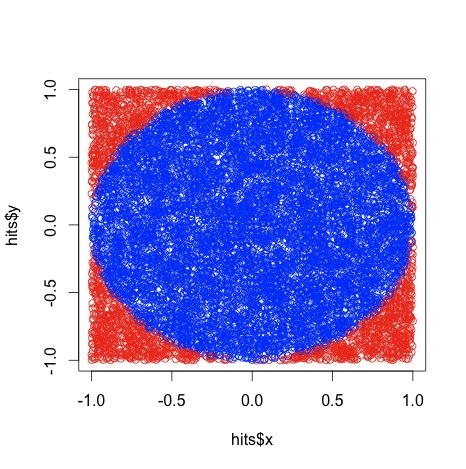
Sorry it is a little squished. That happened when I saved it as a jpg. Ignoring that, it looks a heck of a lot like a circle, no? Are we done? Not quite. Run that code and see what it says pi is. I just ran it and it said pi was 3.096. What gives? I thought pi was 3.14? Oh, come on, we're estimating pi by throwing darts at a wall. What did you expect? All kidding aside, what do you think happens if you try it with 5,000 throws? How about 10,000 throws? I will tell you what happens. You'll likely get a more accurate estimate. This is called a Monte Carlo method. Go look it up.
Let's see how the number of throws affects the accuracy of our estimate. Let's try 1 throw, then 2, then 3 all the way to 10000 and see if our estimates get better. Let's write another program that loops 10,000 times, stores the error and plots the errors on a scatterplot. Here's the code:
#just run this 1 liner after executing the code above
plot(result[1,],result[3,],pch='.')
And here's the plot. Y axis is error, X is number of throws:
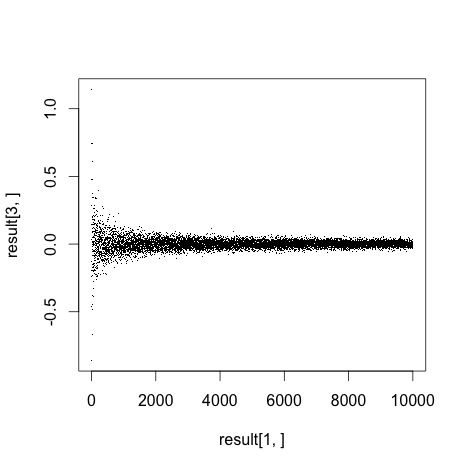
Notice how the error gets closer to zero with the more throws we make. Awesome! I think we just learned a lot about pi and a little bit about Monte Carlo methods. I'm still not entirely convinced.
Look at that graph, how do we really know that error is going to zero? I don't think we do. I'd like to try something a little different. Re-run the first program (where dart throws = 1000) a few times. Notice how you get a different estimate each time. It might be nice to run that program a thousand times and see what the result's distribution looks like. Namely, it would be nice to know the accuracy's standard deviation for the 1,000 runs. That should illustrate the result's consistency that particular number of dart throws. I'd argue that more dart throws not only gives us a result that's more accurate (error closer to zero), but also a result that is more consistent (Smaller standard deviation). Could we write a program that calculates standard deviation of results for 1 throw, then 2, then 3 all the way up to 1000 and graph the results? Sure. Here's one way to do exactly that:
runs<-1000 #number of runs per test
tests<-1000 #number of tests. test 1 throws 1 dart, 2 throws 2 darts, etc.
sdresult = array(dim=c(1,tests))

test=1
for(test in 1:tests){

  i=1
  result = array( dim=c(3,runs))

  for (i in 1:runs) {
    hits <- data.frame(x=runif(test,-1,1),y=runif(test,-1,1))
    hits$d<-sqrt(hits$x^2+hits$y^2)
    inside <-subset(hits, d<1)
    estpi<-4*nrow(inside)/test
    esterr<-pi - estpi

    result[1,i]<-i
    result[2,i]<-estpi
    result[3,i]<-esterr
  }
  sdresult[1,test]<-sd(result[3,])
}
plot (sdresult[1,])
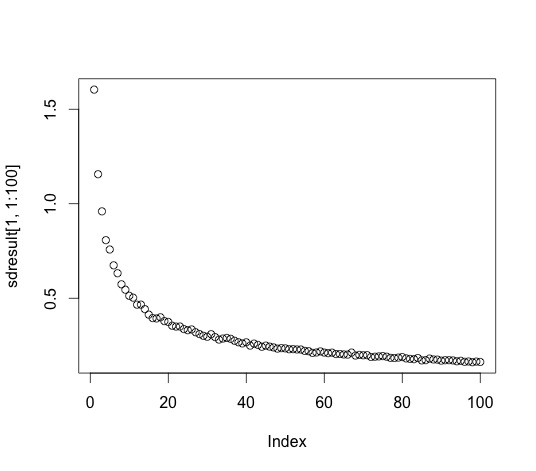
Here's the standard deviation plot of the error for 1 to 100 dart throws. Y axis is standard deviation of error, X is number of throws:
Here's the standard deviation for 1 to 1000 dart throws:
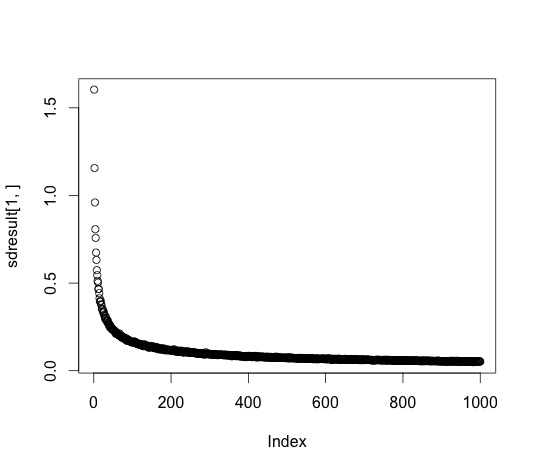
We already showed that the more throws gives you more accurate results. This graph shows that more throws also gives a smaller variance in those results. This graph nicely illustrates the non-linear relationship between accuracy and number of trials. You get a big boost of accuracy going from 10-20 throws, but not a whole lot going from 990 to 1000.
There's a way to calculate how accurate your result is without doing all this, but I am tired. That's all for today. Thanks for reading!