Rich People - Who They Are
and where they live if you read the article.
After reading this huffpo article identifying the richest person in each state I decided I wanted to know more about what these people did to get there. Here is a poorly curated list ignoring the Waltons because, you know, Walllmarts. I'm sure these aren't the most interesting stories, but I was surprised at how many people didn't simply inherit all their wealth.
Phil Knight Nike http://en.wikipedia.org/wiki/Phil_Knight
Larry Ellison Oracle http://en.wikipedia.org/wiki/Larry_Ellison
Sheldon Adelson casinos http://en.wikipedia.org/wiki/Sheldon_Adelson
Frank VanderSloot multilevel marketing http://en.wikipedia.org/wiki/Frank_Vandersloot
Jon Huntsman, Sr. polystyrene and chemicals http://en.wikipedia.org/wiki/Jon_Huntsman,_Sr.
Bruce Halle Discount Tire http://en.wikipedia.org/wiki/Bruce_Halle
Dennis Washington (montana) Construction http://en.wikipedia.org/wiki/Dennis_Washington
charles Ergen Dish Network and EchoStar http://en.wikipedia.org/wiki/Charles_Ergen
Maloof Brothers Gaming and beverage distributors http://en.wikipedia.org/wiki/Maloof_family
Gary Tharaldson Hotels http://en.wikipedia.org/wiki/Gary_Tharaldson
T. Denny Sanford credit cards for poor people http://en.wikipedia.org/wiki/T._Denny_Sanford
Harold Hamm oil, shale http://en.wikipedia.org/wiki/Harold_Hamm
Whitney MacMillan cargill http://en.wikipedia.org/wiki/Whitney_MacMillan
Harry Stine seed http://www.stineseed.com/about-stine/media/company-leadership/harry-h-stine/
Jack Taylor Enterprise Rent-A-Car http://en.wikipedia.org/wiki/Jack_C._Taylor
Tom Benson car dealerships/lucky investments http://en.wikipedia.org/wiki/Tom_Benson
Jon Menard Hardware Stores http://en.wikipedia.org/wiki/John_Menard,_Jr.
Ken Griffin Hege Funds, Citadel http://en.wikipedia.org/wiki/Kenneth_C._Griffin
Leslie Lampton, oil refining and distribution http://en.wikipedia.org/wiki/Ergon,_Inc.
Hank and Doug Meijer retail http://en.wikipedia.org/wiki/Meijer
Gayle Cook medical devices http://en.wikipedia.org/wiki/William_Cook_(entrepreneur)
Bradley Hughes public storage dba a REIT http://en.wikipedia.org/wiki/B._Wayne_Hughes
Thomas Frist KFC and for-profit hospitals http://en.wikipedia.org/wiki/Thomas_F._Frist,_Jr.
Leslie Wexner Retail - Limited Brands http://en.wikipedia.org/wiki/Leslie_Wexner
Marguerite Harbert inherited from construction work http://en.wikipedia.org/wiki/John_M._Harbert
Jim Justice mining grain farms http://www.forbes.com/profile/jim-justice-ii/
Anne Cox Chambers media http://en.wikipedia.org/wiki/Anne_Cox_Chambers
Charles Johnson mutual funds http://en.wikipedia.org/wiki/Charles_Bartlett_Johnson
Mary Alice Dorrance Malone campbell soup http://www.forbes.com/profile/mary-alice-dorrance-malone/
Jacqueline Mars mars candy http://en.wikipedia.org/wiki/Jacqueline_Mars
James Goodnight SAS http://en.wikipedia.org/wiki/James_Goodnight
Anita Zucker married to http://en.wikipedia.org/wiki/Jerry_Zucker_(businessman)
John Abele Boston Scientific http://en.wikipedia.org/wiki/John_Abele
Leon Gorman retail, L.L. Bean http://en.wikipedia.org/wiki/Leon_Gorman
Rick Cohen wholesale groceries http://en.wikipedia.org/wiki/Richard_B._Cohen
Abigail Johnson Fidelity family money http://en.wikipedia.org/wiki/Abigail_Johnson
Jonathan Nelson founded Providence Equity Partners http://en.wikipedia.org/wiki/Jonathan_M._Nelson
Ray Dalio Bridgewater http://en.wikipedia.org/wiki/Ray_Dalio
David Tepper finance http://en.wikipedia.org/wiki/David_Tepper
Robert Gore Teflon, Gore-Tex http://en.wikipedia.org/wiki/Robert_W._Gore
Ted Lerner real estate development http://en.wikipedia.org/wiki/Ted_Lerner
Using the Kelly Criterion to Manage a Bankroll in Stock Markets
why the hell not
I stumbled upon an interesting sentence while working my way through "An Introduction to Statistical Learning with Applications in R." By the way, the book is available for free here. You should check it out! I don't have any strong opinions on how useful it is, yet, for I only just started reading. But, so far so good.
About that sentence. It says:
Nevertheless, in Chapter 4, we explore these data using several different statistical learning methods. Interestingly, there are hints of some weak trends in the data that suggest that, at least for this 5-year period, it is possible to correctly predict the direction of movement in the market approximately 60% of the time
I immediately thought that this might be an excellent exercise to learn how the Kelly Criterion could be used to optimize returns. The Kelly Criterion is a method to determine the optimal size of a series of bets each of which is given by (directly from wikipedia )
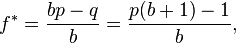
where:
- f* is the fraction of the current bankroll to wager, i.e. how much to bet;
- b is the net odds received on the wager ("b to 1"); that is, you could win $b (on top of getting back your $1 wagered) for a $1 bet
- p is the probability of winning;
- q is the probability of losing, which is 1 − p.
The idea is if you invest (bet) according to the formula, you will do better in the long run than had you used any different betting strategy. When I read the sentence about being able to reliably predict the market's direction I thought it might be fun to apply the Kelly Criterion to see what kind of returns you could get.
If you're paying attention, you might have noticed the formula that requires you to know the net odds received on the bet. That is, you not only have to know the direction, but also the magnitude. Doh! Let's not let that stop us from seeing if we can get some results.
The book uses Quadratic Discriminant Analysis (QDA) to fit an QDA model to stock market data to predict the direction of market movement over a period of time. The dataset consists of percentage returns for the S&P 500 over 1, 250 days from 2001 to the end of 2005. The idea is to use the percent return for each of the previous five days and the volume traded on teh previous day to predict direction. Once the model is trained, you can run the predict() function to get the probability of the market direction given five days of previous percent changes and the previous day's volume. In other words, feed the predict function the right data and make a trade based on what the function says to do. You have a 60% chance of being correct.
Wasn't I talking about the Kelly Criterion a minute ago? Yes! I was. If you have an edge (that is, a greater than 50% chance of winning) there is an optimal betting strategy that will maximize your returns while guaranteeing your bank roll won't go to zero.
Let's pretend we are investing in an S&P 500 ETF. Ignoring taxes and transaction costs (of course) your strategy is to buy at market open and sell at market close. If the market is predicted to go up, buy long. If the market is predicted to go down, short the ETF. How much you buy is defined by the Kelly Criterion function defined above. p = 60% but what is the net odds? Let's be naive and compute it as the volatility for the previous five days.
 install.packages("ISLR")
 library(ISLR)
 library(MASS)
 summary(Smarket)
 attach(Smarket)
 plot(Volume)
 train=(Year <2005)
 Smarket.2005= Smarket [! train ,]
 dim(Smarket.2005)
 Direction.2005=Direction[!train]
 qda.fit=qda(Direction~Lag1+Lag2,data=Smarket ,subset=train)
 qda.fit

Call:
qda(Direction ~ Lag1 + Lag2, data = Smarket, subset = train)

Prior probabilities of groups:
    Down       Up
0.491984 0.508016

Group means:
            Lag1        Lag2
Down  0.04279022  0.03389409
Up   -0.03954635 -0.03132544


 qda.class=predict(qda.fit,Smarket.2005)$class
 table(qda.class ,Direction.2005)
 mean(qda.class==Direction.2005)
 export it to csv

write.csv(Smarket.2005, file="/tmp/Smarket.2005.csv")
write.csv(qda.class, file="/tmp/qda.class.csv")
I exported it to csv so I could work with it in python and pandas because I'm more comfortable in that environment
and I'm not sure there are any examples using pandas on this site, yet. I use it way more than I use r,
believe it or not.
Ok, so,
Smarket.2005.csv has rows numbered 999-1250 and qda.class.csv has rows numbered 1-252 which means the rows will line
up. Let's pull them into ipython notebook.
Aaaand, it is bed time. BUT, there isn't much more to do other than show gain/loss for each day using the Kelly Criterion starting with a $10,000 bank roll.
Throwing Darts to Estimate π
finding it statistically.
When you've got a hammer and that hammer is a year's worth of learning probability you sort of want to beat everything into submission with R. To keep with the spirit, let's use us some R and the Monte Carlo method to calculate PI by throwing darts at a dart board.
What is pi? I can't answer that. Here is what I can say; figuring out the area of a circle is tough but figuring out the area of a square is easy as pie. Just multiply one side by the other (A = S*S or A=S\^2) and you've got the area of a square. We'll start there. An easy way to measure a circle is center to the edge. That's the radius (R). If we multiply R * R to calculate the area of a circle, we'll wind up with not the area of the circle, but the area of a square that is 1/4 the size of the circle. Stay with me. Here is a picture:
Picture of 1/4 circle inside a square.
We're getting somewhere. Imagine we could somehow subtract the excess area (That shaded part.) Do that, multiply by 4 and you've got the area of a circle. Great! But, how can we possibly figure out how much to take away?
We need to find a number that is the proportion between the area of the square and the area of 1/4 a circle. Say we find that magic number. Then we just multiply the area of the square by that number, multiply by 4 and we're golden. Of course, the number is going to be less than 1 because the 1/4 circle fits inside the square.
Area of a Circle = 4 * magic number * R\^2
Guess what, 4 * magic number equals pi. You're almost there. The trouble is how do you figure out the magic number?
Remember when I said it was the proportion between the size of the square and the size of the 1/4 circle? How can we possibly figure out the proportion? What if we throw some darts at it? If we don't aim, every dart should hit a random place on the board. Some will wind up in the circle. Some will be outside. If we count the number that land inside and divide by the total number of throws, we've got some sort of a proportion. Could that possibly work?
Why not? In fact, let's throw a bunch of darts at it. Count the number of darts that land inside the circle and divide by the number of darts thrown. Doing that gives you the proportion:
Number of darts inside circle / total darts = area of a circle / area of the square
Take a second to realize the proportion is exactly the same if you're throwing darts at 1/4 of a circle enclosed in a square or a whole circle enclosed in a larger square. The circle in a square is completely symmetric. So, you'll get the same proportion if you figure it out once, or a dozen times (in this case, it is 4 times.) Make sense? Great!
Ok then, let's throw some darts at a board and start counting. If you think about it, the more darts you throw, the better your estimate should be. (we'll show that's true in a minute.) Go ahead and throw 1,000 darts and count them Wait, what? You're too busy for that? Ok, let's simulate it with a computer. Here is some R code that will do exactly that.
i=1
n<-10000
result = array( dim=c(3,n))

for (i in 1:n) {

  hits <- data.frame(x=runif(i,-1,1),y=runif(i,-1,1))
  hits$d<-sqrt(hits$x^2+hits$y^2)

  inside <-subset(hits, d<1)

  estpi<-4*nrow(inside)/i

  esterr<-pi - estpi

  result[1,i]<-i
  result[2,i]<-estpi
  result[3,i]<-esterr
}
# plot
hits$col<-ifelse(hits$d > 1, 1,2)
plot(hits$x,hits$y, col=c('red','blue')[hits$col],pch='.')
The code plots the points inside the circle in blue and those outside in red by calculating the point's distance from the origin. Here's the plot:
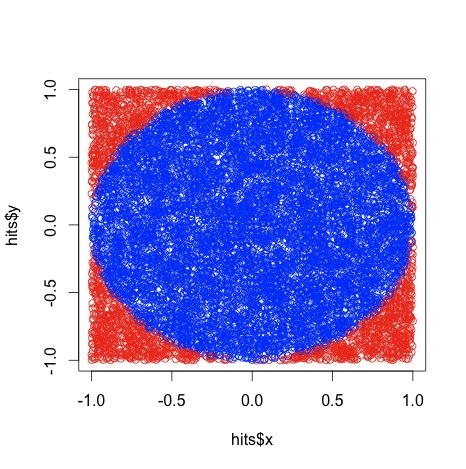
Sorry it is a little squished. That happened when I saved it as a jpg. Ignoring that, it looks a heck of a lot like a circle, no? Are we done? Not quite. Run that code and see what it says pi is. I just ran it and it said pi was 3.096. What gives? I thought pi was 3.14? Oh, come on, we're estimating pi by throwing darts at a wall. What did you expect? All kidding aside, what do you think happens if you try it with 5,000 throws? How about 10,000 throws? I will tell you what happens. You'll likely get a more accurate estimate. This is called a Monte Carlo method. Go look it up.
Let's see how the number of throws affects the accuracy of our estimate. Let's try 1 throw, then 2, then 3 all the way to 10000 and see if our estimates get better. Let's write another program that loops 10,000 times, stores the error and plots the errors on a scatterplot. Here's the code:
#just run this 1 liner after executing the code above
plot(result[1,],result[3,],pch='.')
And here's the plot. Y axis is error, X is number of throws:
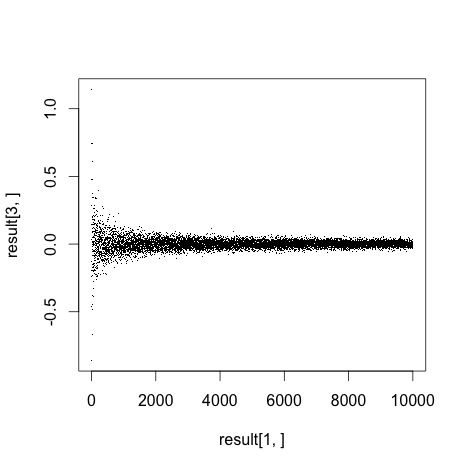
Notice how the error gets closer to zero with the more throws we make. Awesome! I think we just learned a lot about pi and a little bit about Monte Carlo methods. I'm still not entirely convinced.
Look at that graph, how do we really know that error is going to zero? I don't think we do. I'd like to try something a little different. Re-run the first program (where dart throws = 1000) a few times. Notice how you get a different estimate each time. It might be nice to run that program a thousand times and see what the result's distribution looks like. Namely, it would be nice to know the accuracy's standard deviation for the 1,000 runs. That should illustrate the result's consistency that particular number of dart throws. I'd argue that more dart throws not only gives us a result that's more accurate (error closer to zero), but also a result that is more consistent (Smaller standard deviation). Could we write a program that calculates standard deviation of results for 1 throw, then 2, then 3 all the way up to 1000 and graph the results? Sure. Here's one way to do exactly that:
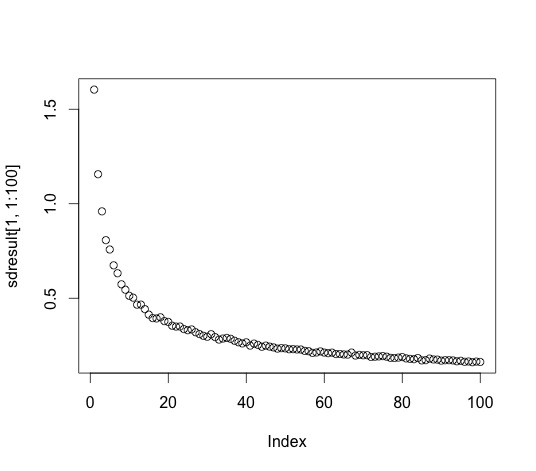
runs<-1000 #number of runs per test
tests<-1000 #number of tests. test 1 throws 1 dart, 2 throws 2 darts, etc.
sdresult = array(dim=c(1,tests))

test=1
for(test in 1:tests){

  i=1
  result = array( dim=c(3,runs))

  for (i in 1:runs) {
    hits <- data.frame(x=runif(test,-1,1),y=runif(test,-1,1))
    hits$d<-sqrt(hits$x^2+hits$y^2)
    inside <-subset(hits, d<1)
    estpi<-4*nrow(inside)/test
    esterr<-pi - estpi

    result[1,i]<-i
    result[2,i]<-estpi
    result[3,i]<-esterr
  }
  sdresult[1,test]<-sd(result[3,])
}
plot (sdresult[1,])
Here's the standard deviation plot of the error for 1 to 100 dart throws. Y axis is standard deviation of error, X is number of throws:
Here's the standard deviation for 1 to 1000 dart throws:
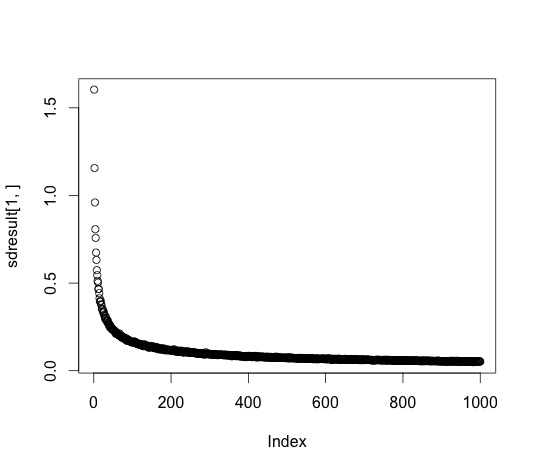
We already showed that the more throws gives you more accurate results. This graph shows that more throws also gives a smaller variance in those results. This graph nicely illustrates the non-linear relationship between accuracy and number of trials. You get a big boost of accuracy going from 10-20 throws, but not a whole lot going from 990 to 1000.
There's a way to calculate how accurate your result is without doing all this, but I am tired. That's all for today. Thanks for reading!