Using the Kelly Criterion to Manage a Bankroll in Stock Markets
why the hell not
I stumbled upon an interesting sentence while working my way through "An Introduction to Statistical Learning with Applications in R." By the way, the book is available for free here. You should check it out! I don't have any strong opinions on how useful it is, yet, for I only just started reading. But, so far so good.
About that sentence. It says:
Nevertheless, in Chapter 4, we explore these data using several different statistical learning methods. Interestingly, there are hints of some weak trends in the data that suggest that, at least for this 5-year period, it is possible to correctly predict the direction of movement in the market approximately 60% of the time
I immediately thought that this might be an excellent exercise to learn how the Kelly Criterion could be used to optimize returns. The Kelly Criterion is a method to determine the optimal size of a series of bets each of which is given by (directly from wikipedia )
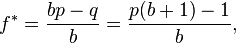
where:
- f* is the fraction of the current bankroll to wager, i.e. how much to bet;
- b is the net odds received on the wager ("b to 1"); that is, you could win $b (on top of getting back your $1 wagered) for a $1 bet
- p is the probability of winning;
- q is the probability of losing, which is 1 − p.
The idea is if you invest (bet) according to the formula, you will do better in the long run than had you used any different betting strategy. When I read the sentence about being able to reliably predict the market's direction I thought it might be fun to apply the Kelly Criterion to see what kind of returns you could get.
If you're paying attention, you might have noticed the formula that requires you to know the net odds received on the bet. That is, you not only have to know the direction, but also the magnitude. Doh! Let's not let that stop us from seeing if we can get some results.
The book uses Quadratic Discriminant Analysis (QDA) to fit an QDA model to stock market data to predict the direction of market movement over a period of time. The dataset consists of percentage returns for the S&P 500 over 1, 250 days from 2001 to the end of 2005. The idea is to use the percent return for each of the previous five days and the volume traded on teh previous day to predict direction. Once the model is trained, you can run the predict() function to get the probability of the market direction given five days of previous percent changes and the previous day's volume. In other words, feed the predict function the right data and make a trade based on what the function says to do. You have a 60% chance of being correct.
Wasn't I talking about the Kelly Criterion a minute ago? Yes! I was. If you have an edge (that is, a greater than 50% chance of winning) there is an optimal betting strategy that will maximize your returns while guaranteeing your bank roll won't go to zero.
Let's pretend we are investing in an S&P 500 ETF. Ignoring taxes and transaction costs (of course) your strategy is to buy at market open and sell at market close. If the market is predicted to go up, buy long. If the market is predicted to go down, short the ETF. How much you buy is defined by the Kelly Criterion function defined above. p = 60% but what is the net odds? Let's be naive and compute it as the volatility for the previous five days.
 install.packages("ISLR")
 library(ISLR)
 library(MASS)
 summary(Smarket)
 attach(Smarket)
 plot(Volume)
 train=(Year <2005)
 Smarket.2005= Smarket [! train ,]
 dim(Smarket.2005)
 Direction.2005=Direction[!train]
 qda.fit=qda(Direction~Lag1+Lag2,data=Smarket ,subset=train)
 qda.fit

Call:
qda(Direction ~ Lag1 + Lag2, data = Smarket, subset = train)

Prior probabilities of groups:
    Down       Up
0.491984 0.508016

Group means:
            Lag1        Lag2
Down  0.04279022  0.03389409
Up   -0.03954635 -0.03132544


 qda.class=predict(qda.fit,Smarket.2005)$class
 table(qda.class ,Direction.2005)
 mean(qda.class==Direction.2005)
 export it to csv

write.csv(Smarket.2005, file="/tmp/Smarket.2005.csv")
write.csv(qda.class, file="/tmp/qda.class.csv")
I exported it to csv so I could work with it in python and pandas because I'm more comfortable in that environment
and I'm not sure there are any examples using pandas on this site, yet. I use it way more than I use r,
believe it or not.
Ok, so,
Smarket.2005.csv has rows numbered 999-1250 and qda.class.csv has rows numbered 1-252 which means the rows will line
up. Let's pull them into ipython notebook.
Aaaand, it is bed time. BUT, there isn't much more to do other than show gain/loss for each day using the Kelly Criterion starting with a $10,000 bank roll.